
Sign up to receive email notices of recent acquisitions.
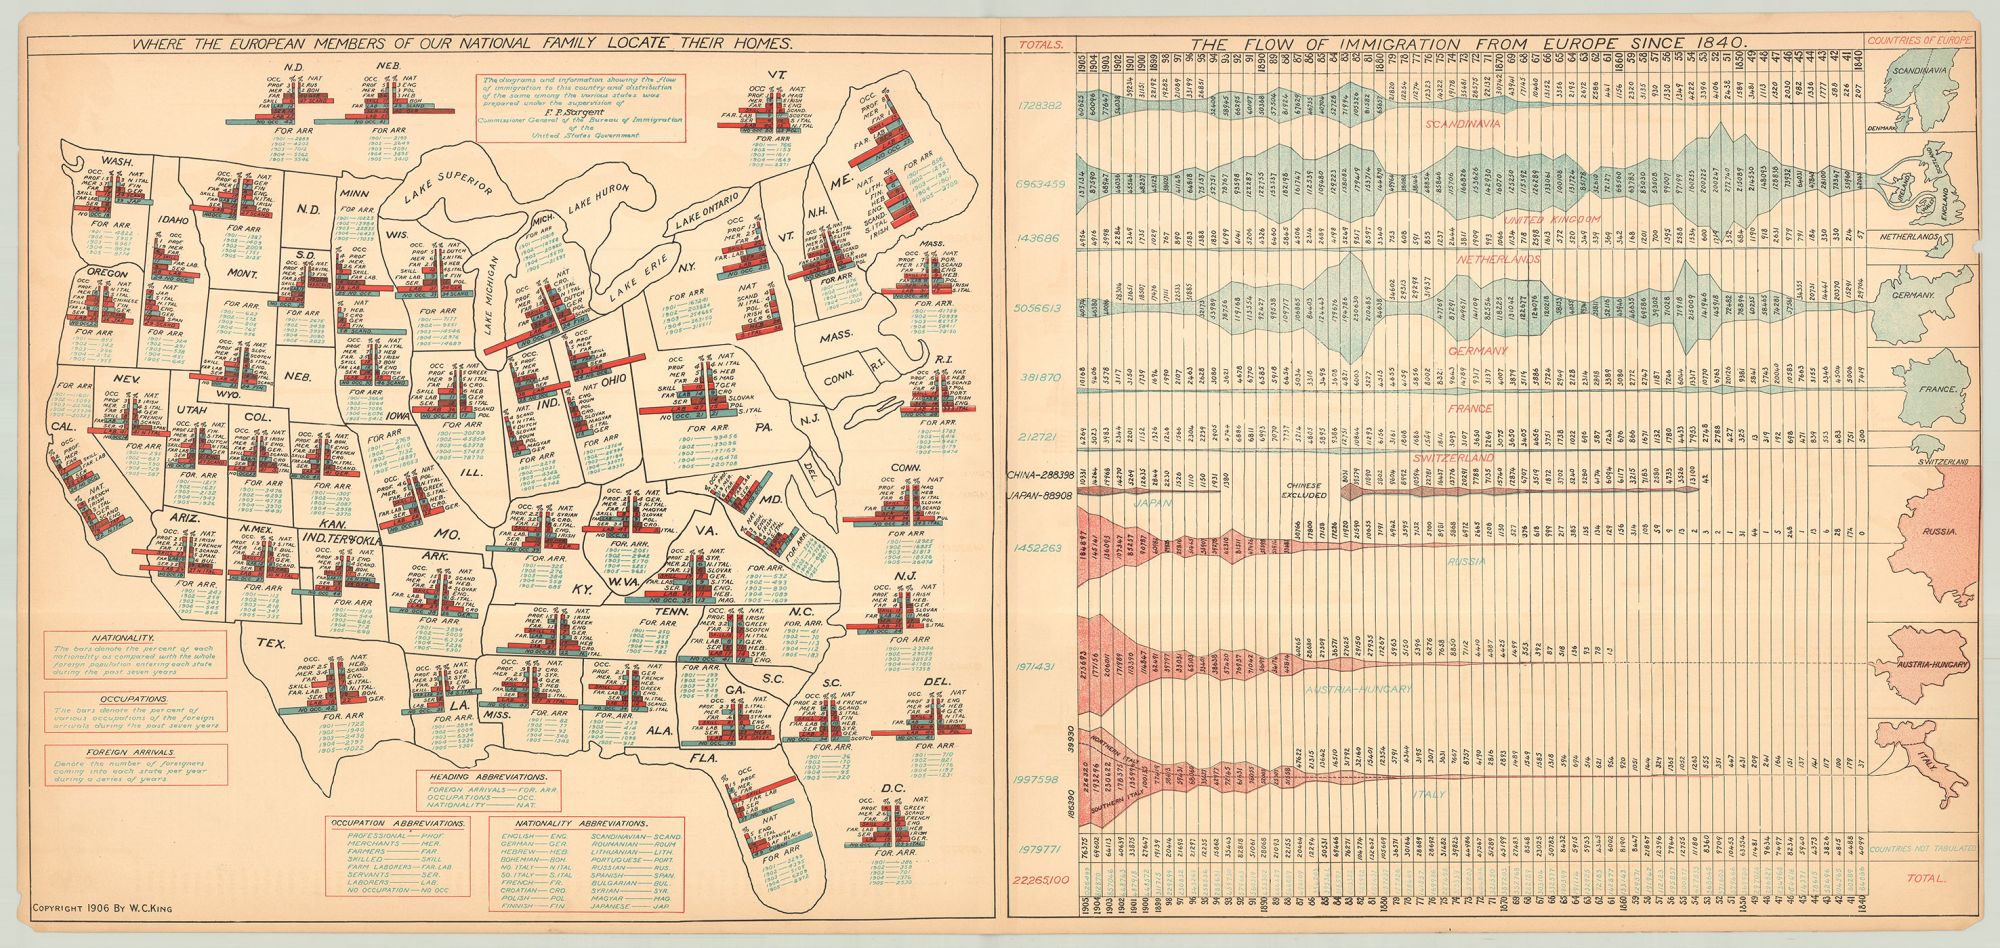
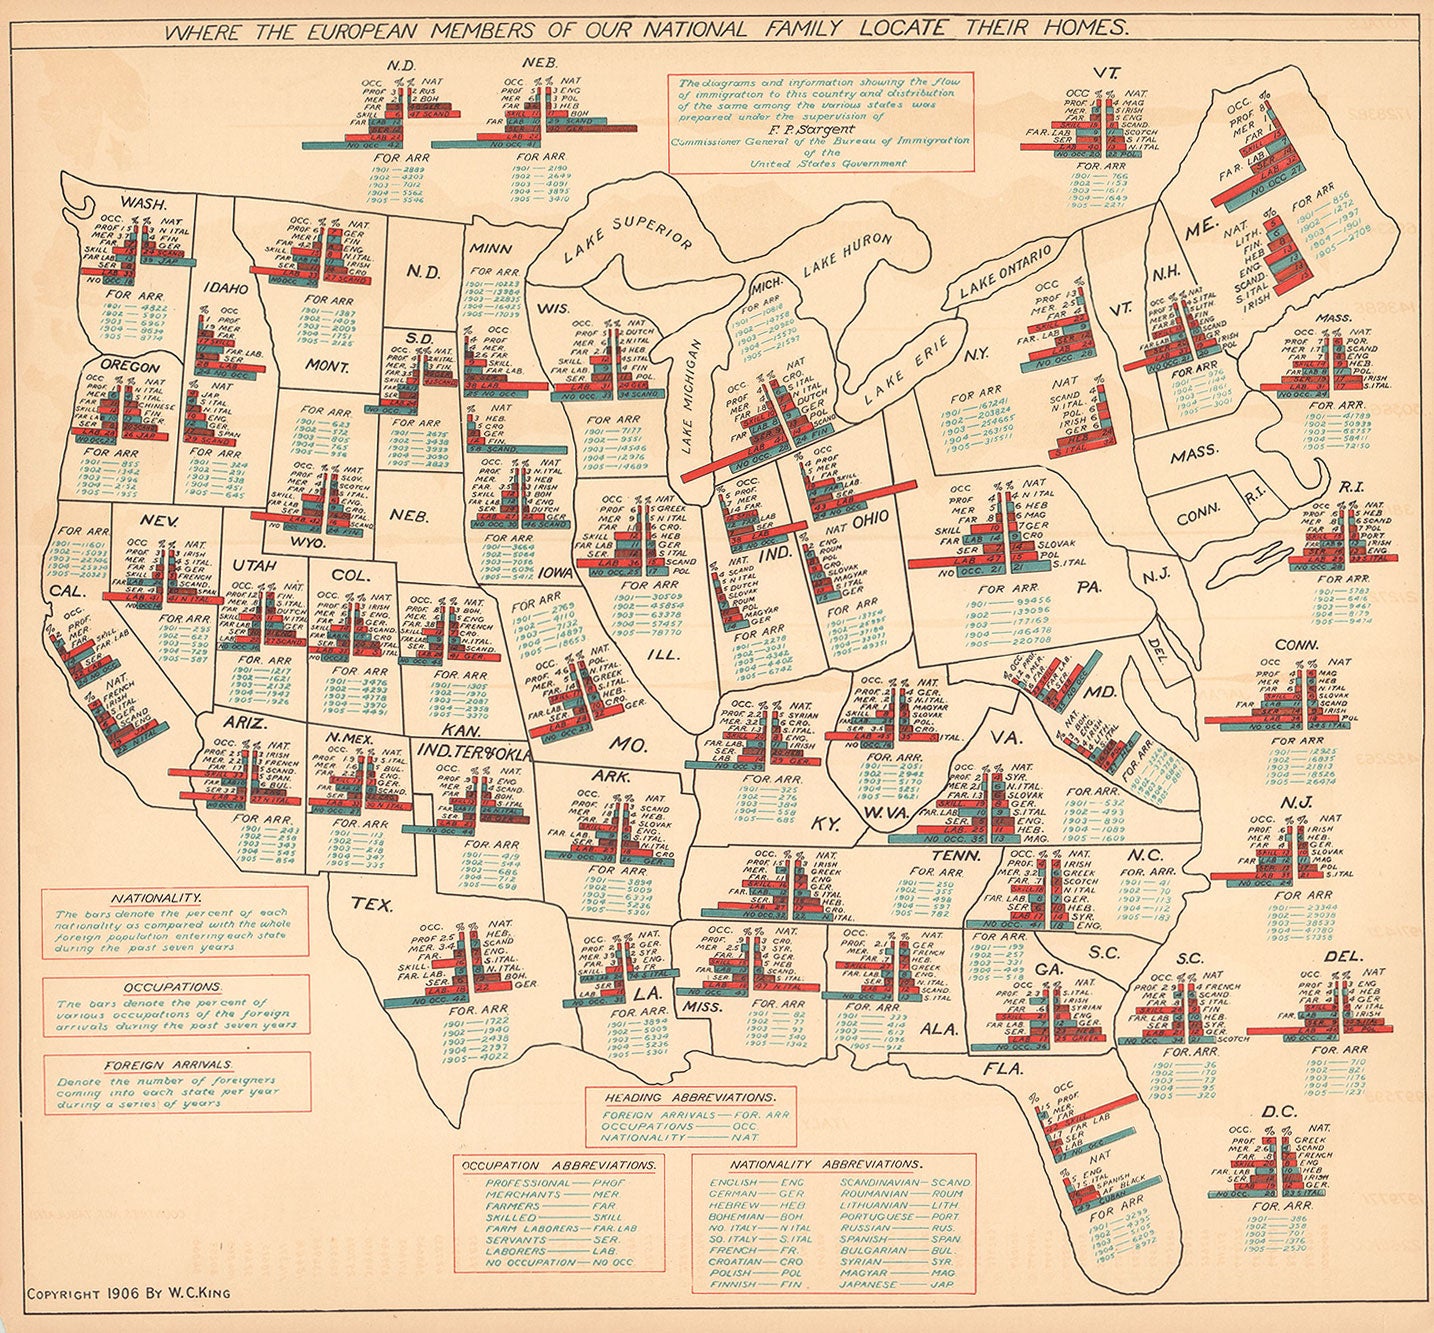
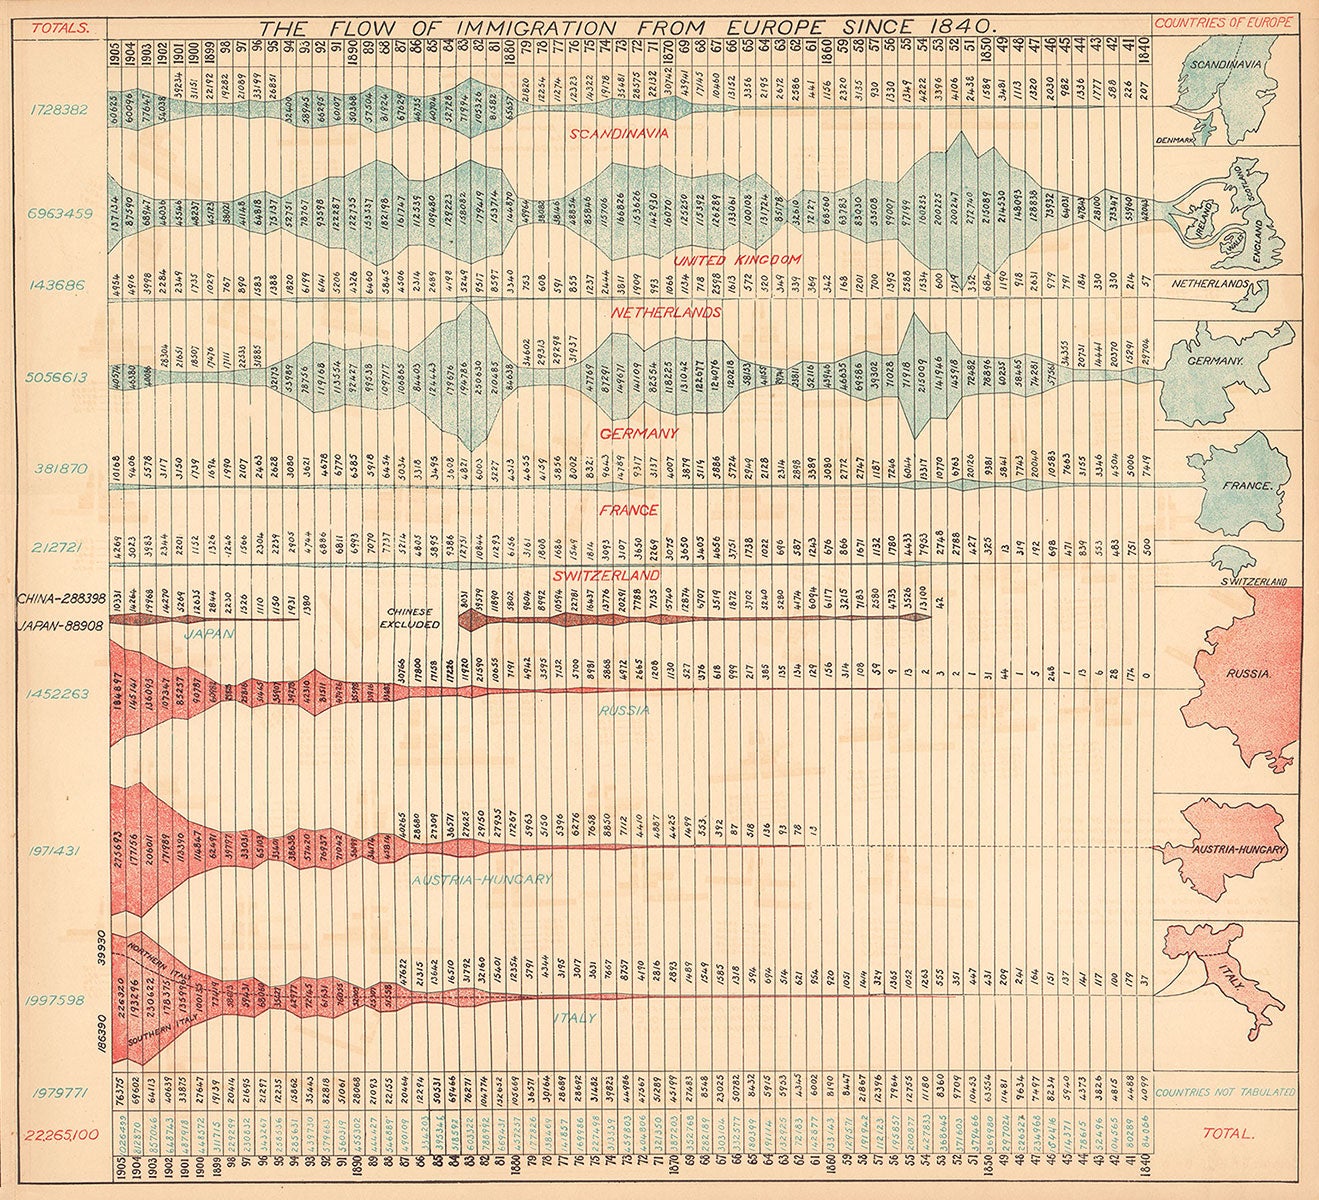
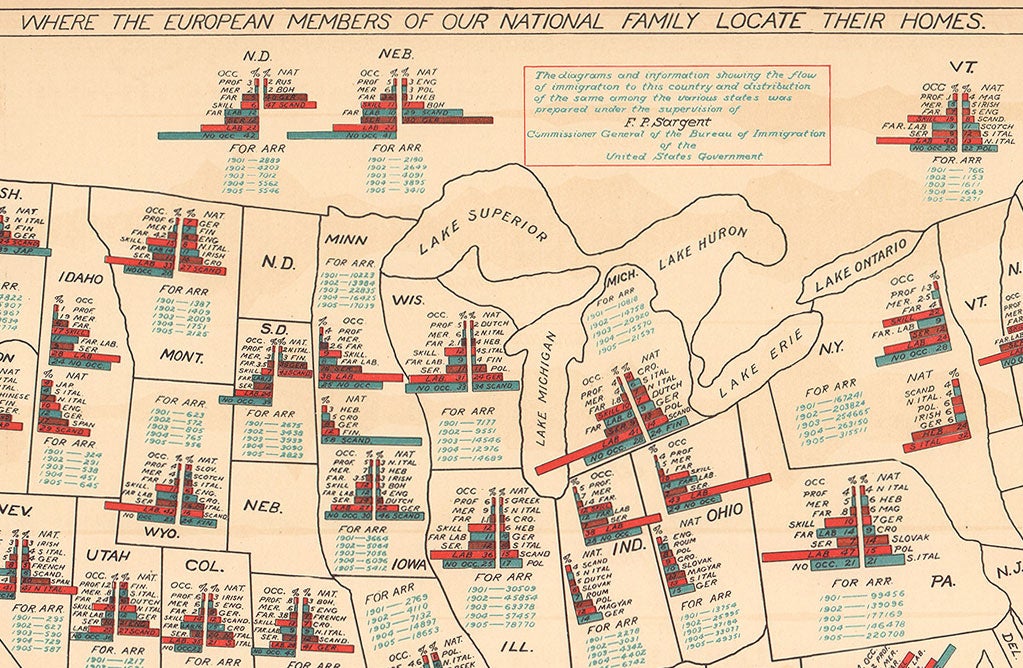
Where The European Members of Our National Family Locate Their Homes. The Flow of Immigration From Europe Since 1840.
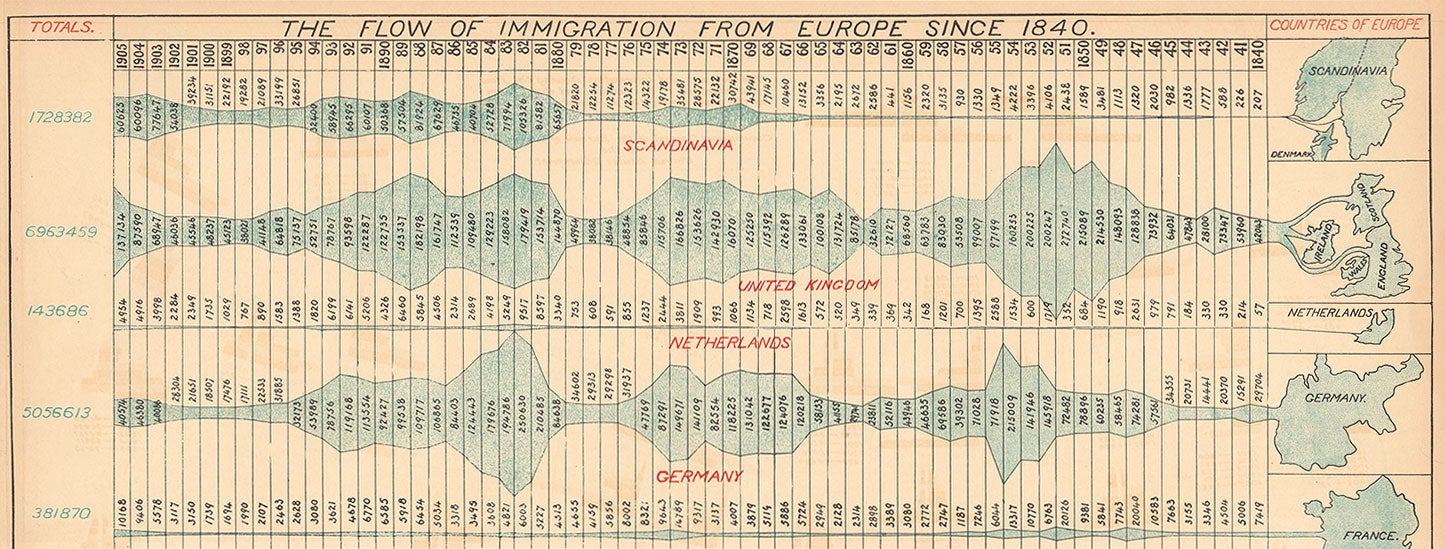
Springfield, Mass.: W.C. King Co., 1906. Map, 16.5” x 35.50”. A map depicting the European immigrant population in America state-by-state, accompanied by a ‘streams of time’ chart visually representing European emigration to the U.S. between 1840 to 1905. Depicting the entirety of the U.S., this informative map and its accompanying chart were prepared under the supervision of F.P. Sargent, Commissioner General of the Bureau of Immigration of the U.S. Government for King’s Illustrated Portfolio of Our Country, a rather scarce atlas published in 1906. The map records the distribution of European immigration in the U.S. using colored ‘infographics’ detailing the immigrant composition of each state. The total populations of “foreign arrivals” in each state over the past five years are also provided. Illinois, for instance, comprises the nationalities of Greek (5%), Italian (5%), Hebrew (6%), Croatian (6%), German (10%), Scandinavian (15%), and Polish (17%); also indicated is an increase in the number of immigrants from 30509 to 78770 between 1901 and 1905. Six keys appear at the bottom of the map with the headings Nationality, Occupations, Foreign Arrivals, Occupation Abbreviations, Heading Abbreviations, and Nationality Abbreviations. Occupations include servants, “skilled,” farmers, “no occupation,” etc. The accompanying chart entitled “Flow of Immigration From Europe Since 1840” depicts immigration in the form of rivers of time. The chart consists of eleven streams flowing out of various aqueous countries, including Scandinavia, Japan, England, Germany, France, Switzerland, Russia, Austria-Hungary, Italy, etc., and each ‘river’ expands and constricts as immigration numbers ebb and flow. The immigration totals for each country appear in a column on the far-left. Listed at the bottom are the total numbers of immigrants from Europe per year, as well as numbers from countries not tabulated in the chart. In China’s stream of time the words “Chinese excluded” appear in the 1880s, a reference to the Chinese Exclusion Act of 1882. This Act barred Chinese workers from coming to America for ten years—a ban that was renewed, and then made permanent, lasting for a total of sixty years. It was the first law the U.S. passed aimed at preventing a specific national or ethnic group from entering the country. A fascinating map published at the peak of immigration to the U.S. REFERENCES: Chinese Exclusion Act Of 1882 at encyclopedia.com CONDITION: Very good, light wear and toning/, two inch tear repaired with document repair tape on verso, small chip out of border at left.
Item #5854
Sold